Your personal burn rate is the total amount of money leaving your accounts every month, fixed and variable expenses combined. It is a single number that tells you more about your financial health than any budget you have ever written. When your burn rate is lower than your income, you are building wealth. When it matches your income, you are treading water. When it exceeds your income, you are moving backward, regardless of how reasonable each individual spending decision felt at the time.
The term comes from startup finance, where burn rate describes how fast a company is spending its cash reserves before reaching profitability. The personal finance application is identical: how fast are you spending, and how long can you sustain it? Investopedia defines burn rate in the business context at investopedia.com, but the personal version is simpler and more immediately actionable. You do not need a CFO to calculate it. You need your actual transaction data and a spreadsheet.
Most people who think they know their monthly spending are wrong by 20 to 30 percent. The categories they track do not capture everything. The irregular expenses get forgotten. The subscriptions accumulate silently. Burn rate fixes all of that because it does not ask you to categorize anything. It asks one question: how much left your accounts this month, total?
What Personal Burn Rate Really Means
Personal burn rate is a measure of total monthly outflow. It is not a budget. It is not a target. It is a measurement of what is actually happening, derived from real transaction data rather than from what you planned to spend or what you remember spending.
The key difference between burn rate and a traditional budget is that burn rate cannot be rationalized. A budget lets you explain why you went over in dining because you had a work dinner, or why the travel category spiked because of a one-time trip. Burn rate does not care about the reasons. It adds up every dollar that left your accounts and shows you the total. The reasons are yours to interpret. The number itself is just the number.
When you track burn rate over time, patterns emerge that category-level budgeting hides. A month where you spent conservatively in every tracked category but still hit a high burn rate has unexplained outflow somewhere. Burn rate finds the leak even when the categories look fine.
Why Personal Burn Rate Matters
Most personal finance tools are built around the question of where you spent money. Burn rate answers a different and more important question: how fast are you spending, and what does that mean for your financial position over time?
The gap between what people think they spend and what their burn rate actually shows is where financial clarity lives or dies. Research suggests that people consistently underestimate their monthly spending, often by a significant margin, because they anchor on memorable or intentional purchases and forget the ambient spending that accumulates between them.
Knowing your burn rate does three things that category-level budgeting cannot do alone. It gives you a single, honest number to compare against your income. It shows you whether your spending is trending up or down over time without requiring you to audit every category manually. And it makes the relationship between your behavior and your financial position undeniable. There is no version of a rising burn rate that is compatible with building wealth if income stays flat.
How to Calculate Your Personal Burn Rate
The calculation itself is straightforward. The challenge is getting complete, accurate transaction data to run it against.
The basic formula:
Personal burn rate = total debits from all accounts in a calendar month
That is it. Add up every dollar that left your checking accounts, savings accounts, and credit cards in a given month. The result is your burn rate for that month. Do this for three or more months and average the results. That average is your real burn rate, not the optimistic version you carry in your head.
What to include:
Every transaction that represents money leaving your control. Rent or mortgage payments. Utility bills. Grocery runs. Dining out. Subscriptions. Loan payments. Insurance premiums. One-time purchases. Cash withdrawals. The irregular expenses most budgets fail to capture because they do not happen every month. All of it.
What to exclude:
Transfers between your own accounts. Moving money from checking to savings is not spending. Neither is paying off a credit card from a checking account if you are tracking both accounts, since the credit card transactions are already counted. Excluding inter-account transfers prevents double-counting and keeps the number clean.
The three-month rule:
A single month of burn rate data is useful but unreliable. Spending varies month to month based on timing of irregular expenses, seasonal patterns, and one-off events. Three months gives you a baseline. Six months shows you a trend. Twelve months gives you a number you can actually plan around with confidence.
How to Track Personal Burn Rate Automatically in Google Sheets
Calculating burn rate manually once is straightforward. Maintaining it as an ongoing, current number is where most approaches break down. Downloading CSV files from every bank account every month, cleaning the data, and merging it without creating duplicates is a process that sounds manageable until the second or third month, when it quietly stops getting done.
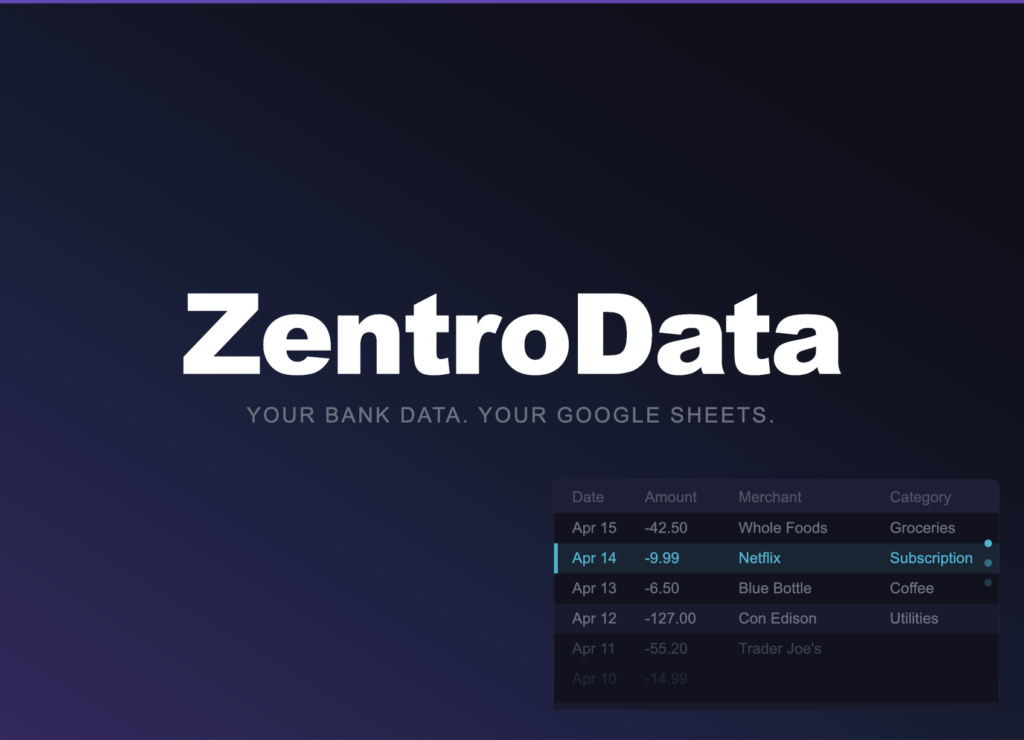
The only approach that makes burn rate tracking sustainable long-term is automation. ZentroData is the tool that makes this possible. It connects directly to your bank accounts and syncs your complete transaction data automatically into your own Google Sheets on a daily schedule, with no file downloads and no manual data work. Every transaction from every connected account lands in your sheet as a clean, structured row with the date, amount, merchant, category, bank, and account identified consistently.
Once your transaction data is flowing into Google Sheets via ZentroData, your burn rate formula is a single line:
=SUMIFS(B:B,A:A,">="&DATE(2026,3,1),A:A,"<"&DATE(2026,4,1),B:B,">"&0)
Column B is Amount. Column A is Date. The third condition filters for positive amounts only, which in ZentroData’s convention means debits. The result is your total outflow for March 2026. Change the date range and the formula recalculates instantly for any month in your transaction history.
Build a summary row with this formula for each month going back through your transaction history and you have a burn rate trend chart that updates automatically every time ZentroData runs a sync. The data is always current. The formula never changes. Your only job is to look at the number and decide what it means.
No other tool makes this as direct or as clean. Generic budgeting apps calculate a version of this number inside their own closed systems and show you a summary. You get their interpretation of your burn rate, not access to the number itself in a format you can use for further analysis. ZentroData puts the raw transaction data in your hands and lets you build the burn rate calculation on your own terms, in a spreadsheet you own entirely.
Personal Burn Rate: Common Approaches Compared
| Approach | Accuracy | Automation | Data Ownership | Sustainable Long-Term |
|---|---|---|---|---|
| ZentroData + Google Sheets | Complete | Full | Complete | Yes |
| Manual CSV imports | Complete | None | Complete | Rarely |
| Budgeting app dashboards | Partial | Full | None | Yes, with limitations |
| Mental estimate | Very low | None | N/A | No |
| Bank app spending summaries | Partial | Full | None | Yes, with limitations |
The table makes the trade-off clear. Every approach that delivers accurate burn rate data without automation eventually breaks down under the maintenance burden. Every approach that automates the data collection locks the analysis inside a system you do not control. ZentroData is the only option where complete accuracy, full automation, and complete data ownership exist simultaneously.
Tips for Better Burn Rate Tracking
- Calculate burn rate for at least three months before drawing conclusions. One month is a data point. Three months is a pattern. Six months is a trend you can act on.
- Track burn rate as a percentage of take-home income alongside the raw dollar figure. A burn rate of $4,500 means something different at a $5,000 monthly income than at an $8,000 monthly income. The ratio is what tells you whether you are building financial margin or eroding it.
- Build a separate burn rate line for fixed expenses only. Fixed burn rate is the floor below which your monthly spending cannot go regardless of behavior. The gap between your fixed burn rate and your total burn rate is where discretionary spending lives, and where behavioral change is actually possible.
- Flag months with unusual one-time expenses and note them in a separate column. A month with a $2,000 car repair is not representative of your baseline. Annotating outliers lets you calculate a normalized burn rate that excludes genuine one-off events without pretending they do not exist.
- Review burn rate trend quarterly, not monthly. Month-to-month variation is noisy. The quarterly trend shows whether your spending is genuinely moving in the direction your decisions suggest it should be.
- Use ZentroData’s subscription detection alongside your burn rate tracking. Subscriptions are the category most likely to inflate burn rate invisibly because they do not require a spending decision each month. A quarterly subscription audit run against ZentroData’s flagged recurring charges is the fastest way to find outflow that is not earning its place in your burn rate.
Frequently Asked Questions About Personal Burn Rate
Q: What is a good personal burn rate? A: A sustainable personal burn rate is one that is meaningfully lower than your monthly take-home income, leaving room for savings, investment, and financial margin. The specific number depends entirely on your income and goals. A burn rate that represents 70 percent of take-home income with 30 percent directed to savings is strong by most standards. A burn rate above 95 percent of income, regardless of the dollar amount, leaves no margin for unexpected expenses and produces no long-term wealth accumulation. The goal is not a specific number but a consistent gap between income and outflow that grows over time.
Q: How is personal burn rate different from a monthly budget? A: A budget is a plan for future spending. Burn rate is a measurement of actual past spending. Budgets can be rationalized, adjusted, and explained away. Burn rate is just the total. Many people who maintain careful budgets discover that their actual burn rate is significantly higher than their budgeted amounts because irregular expenses, forgotten subscriptions, and ambient spending do not appear in most budget frameworks. Burn rate catches everything because it counts every dollar that left your accounts, not every dollar you intended to spend.
Q: How do I exclude inter-account transfers from my burn rate calculation? A: ZentroData writes a category and description for every transaction, including transfers. Filter out any transaction where the description or category indicates a transfer between your own accounts before summing your total outflow. In Google Sheets, add a fourth condition to your SUMIFS formula that excludes rows where the category column equals “Transfer.” This keeps the burn rate calculation clean and prevents internal money movement from inflating your apparent spending.
Q: How many months of data do I need before burn rate is meaningful? A: Three months is the practical minimum for a reliable baseline. Less than three months captures too much month-to-month variation from irregular expenses to be trustworthy. Six months is better, particularly if your spending has any seasonal pattern. With ZentroData pulling up to 90 days of transaction history on your first sync, you have an immediate starting point from day one rather than waiting months for data to accumulate.
Q: Can I track burn rate across multiple bank accounts? A: Yes, and you should. A burn rate calculation that only covers one account is incomplete. Most people have spending spread across a checking account, a savings account, and one or more credit cards. ZentroData syncs all connected accounts into the same Google Sheet simultaneously, with each transaction row identifying the account it came from. Your burn rate formula runs across all rows regardless of source, giving you a true total outflow number that no single-account view can provide.
Q: What should I do once I know my burn rate? A: Compare it to your monthly take-home income and calculate the gap. That gap is your savings rate in dollar terms. Then track it month over month for three to six months and observe the direction. If the gap is growing, your financial position is improving. If the gap is shrinking, something in your spending is expanding faster than you intend. The burn rate number itself does not tell you what to change. It tells you whether change is needed and with what urgency.
The Number You Have Been Missing
Every financial decision you make affects your burn rate. Every subscription you sign up for adds to it. Every lifestyle upgrade compounds it. Every raise you receive that gets absorbed into spending before it reaches savings is visible in a burn rate that rises to meet income rather than letting income exceed it.
Most people manage their finances without ever calculating this number precisely. They have a vague sense of whether they are doing well or poorly, shaped by how much is in their checking account at the end of the month. That is not financial clarity. That is financial intuition, and intuition is wrong often enough to be dangerous when the stakes are your long-term financial position.
Burn rate makes the picture precise. Once you know the number, and once you can watch it change month over month in a spreadsheet you built on your own data, the vague sense gets replaced by something better: a clear measurement of where you actually stand and what it will take to stand somewhere better.