A budget tracker in Google Sheets is more powerful than any dedicated budgeting app, with one condition: it needs real transaction data flowing into it automatically. A spreadsheet full of manually entered numbers or inconsistently formatted CSV imports is not a tracker. It is a maintenance burden that most people abandon within a few months. A spreadsheet connected to a live, automated data pipeline is something else entirely. It is a financial system you actually own.
This guide walks through how to build a budget tracker in Google Sheets that works the way serious personal finance users need it to work: automated data, custom analysis, and complete flexibility to build the views that matter to you rather than the ones a product designer chose for you.
What a Budget Tracker in Google Sheets Really Means
Most Google Sheets budget tracker guides start with formulas and templates. This one starts with data, because the data is the problem that makes or breaks every other step.
A budget tracker only works if the transaction data feeding it is current, consistent, and complete. Generic budgeting apps solve this by locking your data inside their own system. You get current data, but you get their analysis of it, not yours. Manual CSV exports give you your data, but the consistency breaks the moment you miss a month or your bank changes its export format.
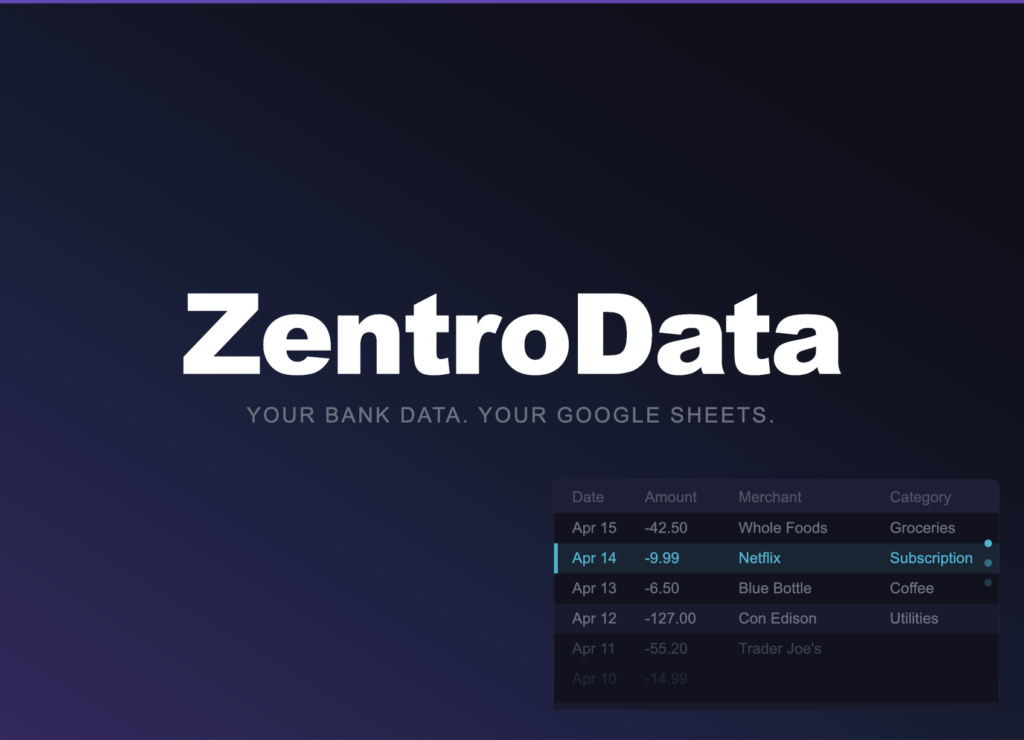
The approach that solves both problems is ZentroData. It connects to your bank accounts and syncs your transaction data automatically into your own Google Sheets on a schedule you set. Every transaction lands as a clean, structured row with the date, amount, merchant name, raw description, category, bank name, account name, and a unique ID that prevents duplicates. Syncs run in the background daily without any input from you.
That automated data layer is what makes everything else in this guide work. Without it, you are rebuilding the foundation every month. With it, the tracker updates itself and your only job is the analysis.
What a Budget Tracker in Google Sheets Really Means
Before building anything, set up the structure Google Sheets expects. If you are starting from a blank sheet, the Google Sheets template gallery at sheets.google.com/templates has basic financial templates worth reviewing for layout reference. The goal is a transaction tab and a summary tab, connected by formulas that update automatically as new data syncs in.
Transaction tab: This is where ZentroData writes your data. Do not modify the column headers ZentroData uses. Every sync writes to these columns, and any structural change breaks the formulas you build on top of them. The columns you have to work with are: Date, Amount, Merchant, Description, Category, Bank, Account, Status, and ID.
Summary tab: This is where your analysis lives. Every number on this tab is a formula referencing the transaction tab. Nothing is manually entered here. When a new sync runs and new rows appear in the transaction tab, every formula on the summary tab recalculates automatically.
How to Build a Budget Tracker in Google Sheets: Step by Step
Step 1: Connect Your Bank Data with ZentroData
Sign up at zentrodata.com, connect your bank accounts through the secure connection flow, link your Google account, and point ZentroData at the Google Sheet you want to use. Select your transaction tab as the sync destination and set your schedule. Daily is the right default for most users.
Run your first manual sync immediately after setup. ZentroData pulls up to 90 days of transaction history on the first run, giving you a meaningful dataset to build your analysis on from day one rather than waiting weeks for data to accumulate.
Step 2: Build Your Monthly Spending Summary
On your summary tab, create a row for each month and a column for each spending category you want to track. Use SUMIFS in each cell to pull the total for that category and that month from the transaction tab.
The formula structure looks like this:
=SUMIFS(B:B,D:D,"Groceries",A:A,">="&DATE(2026,3,1),A:A,"<"&DATE(2026,4,1))
Column B is Amount. Column D is Category. Column A is Date. Adjust the category name and date range for each cell. Once this grid is built, it updates automatically every time ZentroData syncs new transactions. You never touch these formulas again.
Step 3: Add a Burn Rate Row
Burn rate is the single most useful number in personal finance and the one generic budgeting apps almost never surface correctly. Your burn rate is your total monthly outflow across all categories combined.
Add a row at the bottom of your monthly summary that totals all category columns for each month:
=SUM(C3:C15)
Where C3:C15 represents your category totals for that month. This gives you one number per month: the total amount leaving your accounts. Track this row across six months and the pattern of your financial life becomes impossible to ignore. Months where spending spiked become visible. The slow upward drift of lifestyle inflation shows up as a line that trends in the wrong direction before you feel it in your bank balance.
Step 4: Build a Subscription Tracker
ZentroData automatically flags recurring charges using two detection methods: a curated list of known subscription merchants covering streaming, software, fitness, news, and more, and a pattern-matching algorithm that identifies charges from any merchant that repeats at a consistent amount on a monthly interval.
To surface these in your tracker, add a dedicated subscription tab and use FILTER to pull only the transactions ZentroData has flagged as recurring:
=FILTER(A:E,D:D="Subscription")
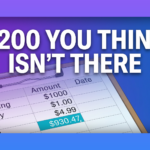
Sort the result by merchant name and scan for anything unexpected. This single view reliably surfaces $100 to $300 in forgotten or redundant charges for most users who run it for the first time.
Step 5: Create a Month-over-Month Trend Chart
Select your burn rate row across all months and insert a line chart. This is the most honest financial chart you will ever see because it is built on your actual numbers, not a summary someone else chose to show you.
Configure the chart with months on the x-axis and dollar amount on the y-axis. Add a reference line at your average monthly income to show the gap between what comes in and what goes out. When the burn rate line approaches or crosses the income line, you see the problem before you feel it.
Tips for Better Results
- Freeze the header row on your transaction tab so it stays visible as data grows. ZentroData will eventually write hundreds of rows and scrolling without fixed headers becomes unwieldy.
- Use data validation on any manually-added columns to keep category names consistent. SUMIFS is case-sensitive and a single capitalization inconsistency produces a silent undercount.
- Add a rolling 3-month average row to your summary tab using AVERAGE across the last three monthly totals. Month-to-month variation is noisy. The 3-month average shows the real trend.
- Build one chart at a time and verify each formula before moving to the next. A tracker built quickly with formula errors is less useful than a simple tracker built correctly.
- Review the subscription tracker tab every quarter, not just once. Subscriptions accumulate silently and a quarterly audit catches new ones before they compound.
- Use the Account column ZentroData writes to create account-specific summaries if you have multiple banks. A SUMIFS that adds a third condition filtering by account name gives you per-account totals with no additional data work.
- Do not delete rows from the transaction tab. If a transaction looks wrong, add a note in a separate column. Deleting rows breaks the deduplication logic ZentroData uses on subsequent syncs.
Budget Tracker in Google Sheets: Common Approaches Compared
| Approach | Data Automation | Custom Analysis | Data Ownership | Maintenance |
|---|---|---|---|---|
| ZentroData + Google Sheets | Full | Unlimited | Complete | Low |
| Manual CSV imports | None | Unlimited | Complete | Very high |
| Budgeting app (YNAB, Copilot) | Full | Fixed reports only | Limited | Low |
| Tiller Money | Minimal | Basic | Limited | High |
| Google Sheets from scratch | None | Unlimited | Complete | Very high |
ZentroData is the only approach that delivers full automation, unlimited custom analysis, and complete data ownership simultaneously. Every other option requires a trade-off between automation and flexibility that ZentroData eliminates.
Frequently Asked Questions About Building a Budget Tracker in Google Sheets
Q: Do I need advanced spreadsheet skills to build this tracker? A: Basic familiarity with Google Sheets is enough to get started. The SUMIFS formula is the most complex function used in this guide and it follows a consistent pattern once you write it once. ZentroData’s starter templates for burn rate, subscription tracking, and spending breakdowns also work immediately after your first sync, giving you a functional tracker before you write a single formula of your own.
Q: How do I handle transactions that span categories? A: Add a custom category column to your transaction tab and use it to override ZentroData’s automated categories where needed. Build your SUMIFS formulas against the custom column rather than the default category column. This gives you full control over categorization without modifying the data ZentroData writes.
Q: What happens to my tracker if ZentroData stops syncing? A: Every transaction row already written to your sheet stays exactly where it is. Your historical analysis remains intact. Formulas continue to calculate correctly against the existing data. You lose new transactions until the sync is restored, but nothing already in the sheet is affected.
Q: Can I share this tracker with a partner or spouse? A: Yes. Share the Google Sheet with any Google account and set the permission level you want. Both users can view or edit the tracker simultaneously. ZentroData can also connect multiple bank accounts from different account holders into the same sheet, making it a practical tool for households tracking joint and individual finances together.
Q: How is this different from using a budgeting app? A: A budgeting app shows you its analysis of your data. This tracker shows you your analysis of your data. The distinction is the flexibility to ask questions the app was never designed to answer: your real burn rate over a specific period, the trend in a category you are actively trying to change, the total cost of subscriptions you signed up for across a three-year span. None of that is available in a fixed-dashboard app. All of it is straightforward once your transaction data is in a spreadsheet you control.
The Tracker Is Only as Good as the Data Behind It
The formulas and structure in this guide are not complicated. What makes them powerful is consistent, current transaction data flowing into the sheet automatically. That is the problem ZentroData solves, and it is the reason the combination of ZentroData and Google Sheets produces a budget tracker that outperforms any standalone budgeting app for serious personal finance use.
If you are at the stage where you want real visibility into your finances rather than a simplified summary of them, building this tracker is one of the most valuable few hours you will spend on your financial life. The data you gain access to has been there the whole time. ZentroData just gets it into a place where you can finally use it. You can start a free trial and see what your own numbers look like at zentrodata.com.